VHES Frequently Asked Questions
Answers to frequently asked questions are presented below. If these do not respond to your query, please contact us at results@vhes.com.au. A comprehensive portal user-guide is also available here for download.
Q: How many survey returns are required to obtain a report?
A: 10 surveys are required to obtain a quarterly report at any level for a reporting period (i.e. a quarter for continuous surveys, a year for annual surveys).
Q: If fewer than 10 surveys are obtained for a campus, what happens to this data? A: The data will still be reported at health service, state and peer group level, provided at least 10 survey returns are received. For continuous, core surveys (Adult Inpatient, Adult Emergency, Maternity, Paediatric Inpatient, Paediatric Emergency), if fewer than 10 surveys are returned for a quarter, these are quarantined until a future quarter. Once 10 survey returns have been received over multiple quarters, a cumulative report is produced, combining each of the quarters into a single report. The user guide has more information on cumulative reporting, with visual examples.
Q: How many responses are needed for a question to be reported?
A: Provided a campus or health service receives the minimum survey return requirement (outlined above), all individual questions will be presented, regardless of how many people answered that question. Some questions are asked only of a small subsection.
Q: What is a level?
A: A level is the unit at which a report is produced. Reports are provided at campus, health service, region, peer group and state
Q: What is the annual participation rate?
A: The annual participation rate is the rolling response rate across the previous four quarters of data collection. This is derived from the number of patients invited to participate divided by the number who completed the survey over the preceding four quarters. The annual participation rate is available for all out-of-service survey categories at all levels of reporting.
Q: What is the positive score?
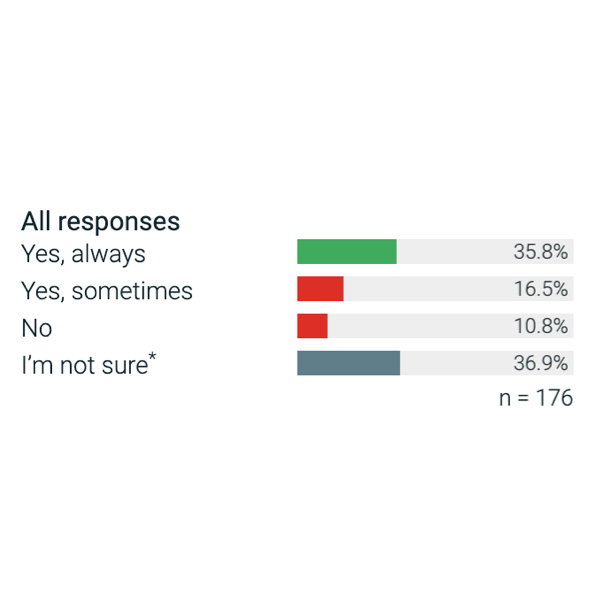
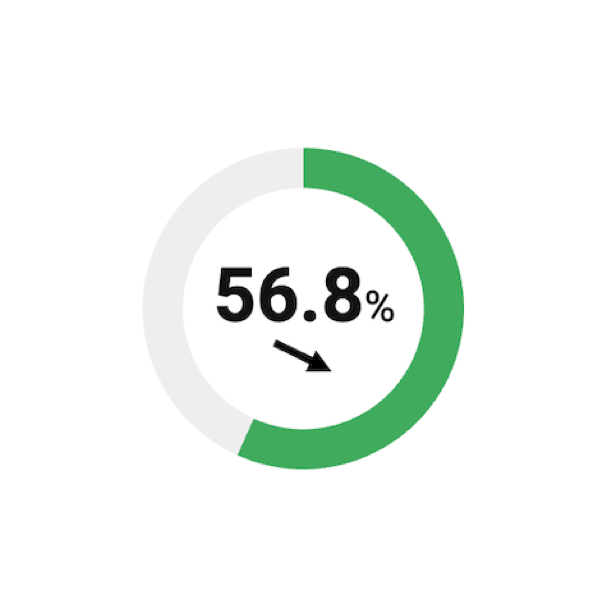
A: The positive score is the proportion of patients nominating the most desired answer or answers for a question e.g. “Yes, always”. This is the score that is plotted over time and compared to other time periods, health services, peer groups, regions and state average answers classed as ‘positive’ are in green in on the dial charts throughout the portal.
Not applicable responses such as “I’m not sure”, “No, but I did not want this” or “This was not needed” are excluded from the base (denominator) when the positive score is calculated. These neutral responses are in blue and have an asterisk next to the response on the detailed results page. Responses excluded from the positive score are also detailed in the question footer on the detailed results page.
If there are two or more positive answers (such as "very good" and "good") these are added together to form the positive score. Note that due to decimal places and/or rounding they may not sum as expected.
Q: How can I see a summary of results?
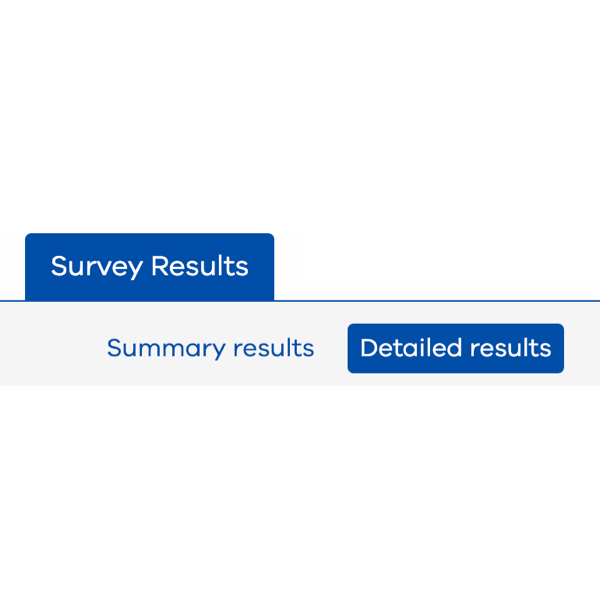
A: You can see a summary of results by clicking on a patient category (e.g. Adult Inpatient) when you are on the ‘Survey Results’ page. A ‘Summary results’ tab will appear under the “Survey Results” tab which will show you a summary of results.
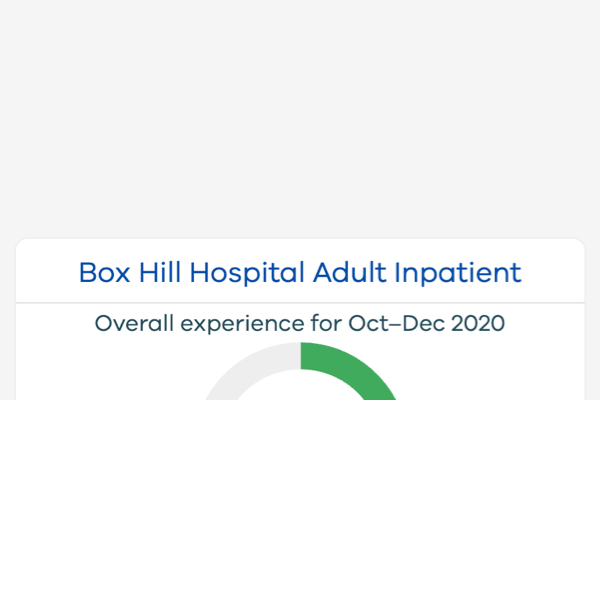
On the ‘Summary Results’ page you will see the participation rates, a summary overview and a chart showing overall experience all for the most recent quarter. The summary results page also provides comparisons for the questions where the subject’s performance has significantly increased or decreased compared to the previous quarter.
When viewing a summary of results for a campus, you will also see comparisons with the associated health service, peer group, region and the statewide results. These comparisons depict the aspects of care that the health service or campus performed significantly higher or lower in than the subject (i.e. state, health service and campus) they are being compared too in the most recent quarter. This feature is only available for published results and not for results published in the interim view.
Q. What are key aspects of care?
The key aspects of care are the three questions that have the greatest impact on a respondents overall experience rating. Where a respondent records positive score on these key aspects of care, they are more likely to report a positive overall experience. A key driver analysis using a binary logistic regression was conducted to determine the key aspects of care.
Q: What does it mean if a comparison is identified as significant?
A ‘significant difference’ means that we can be 95% confident that the difference observed between the two samples reflects a true difference in the population of interest and is not a result of chance. Significance testing is not conducted on interim results.
Q: How can I easily identify key questions that have increased/decreased compared to the previous quarter?
A: This information is available in the Summary Results page. The Comparison with previous period chart will highlight the questions that have improved significantly in green and highlight the questions that have experienced a significant decline in red. Hyperlinks to view detailed results for each of these questions are listed below the chart.
Q: How can I easily identify key questions where my campus or health service differs significantly from the state average?
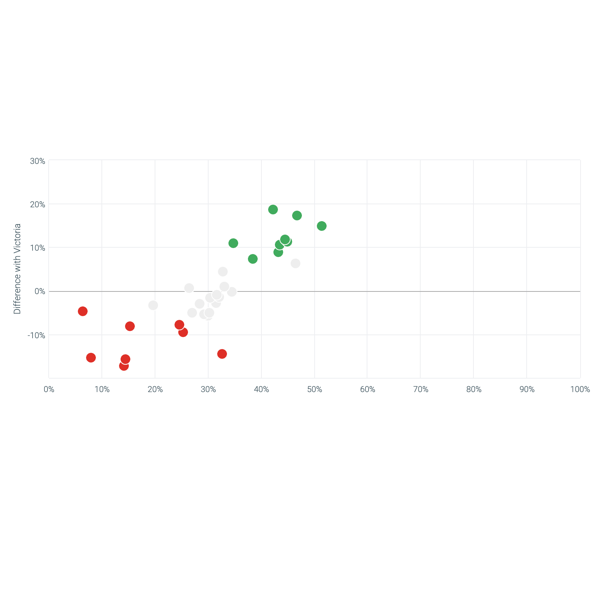
A: This information is available in the Summary Results page. The Comparison with Victoria chart will highlight the questions that have improved significantly better than state average in green and highlight the questions that have performed significantly worse in red. Hyperlinks to view detailed results for each of these questions are listed below the chart.
Q: How can I conduct further data exploration, such as cross tabulation, within the portal?
A: The data exploration tool can be accessed through the portal by clicking on Data explorer tab on the navigation pane.
The data exploration tool facilitates user-led interrogation and analysis using a simple cross-tabulation feature for specific questions. Particular questions can be cross-tabulated against other questions to investigate relationships between the data. Results can also be filtered by patient types or patients that reported the same experiences at the state, region, peer group, health service or campus level across quarters. All analysed data appears as column percentages with significant differences represented by coloured cells. Analysed results can be viewed as tables or charts, at a point in time or over time and data is able to be downloaded to Excel.
Q: How do I interpret each question chart?
A: Please click on the ‘How to use’ heading on the left hand side menu of the page which provides detailed information on how to interpret and navigate charts and data.
Q: How frequently are results provided?
A: Published results for the Inpatient, Emergency and Maternity surveys are reported on a quarterly basis following the completion of data collection for each quarter. The quarters are as follows:
A: Results for each campus for inpatient, emergency and specialist clinics categories are provided only if the campus achieves the minimum survey return requirement (see above) to ensure the data is statistically robust. However, these campuses will still contribute to the peer group, region, health service and state average. Where a campus does not achieve the minimum number of survey returns, the portal will state that there is insufficient data for this period.
Q: How can I see the survey questionnaires?
A:There are distinct questionnaires for each patient category. Each include a common set of Core Questions used across all surveys, and a unique module. To download a pdf version of a questionnaire, go into the ‘Resources’ tab and beneath the heading ‘Questionnaire downloads’, choose the questionnaire you wish to download by clicking on the title.
Q: How can I see the patient comments?
A: De-identified patient comments are available at campus level for all open-ended questions on the ‘expanded results page’. Users can only see comments for campuses belonging to their health service. Patient comments are also available for download on the 'expanded results page'.
Classified patient comments are included in categorical charts on the VHES reporting portal. Comments are allocated into one or more topics or categories based upon the content of the comment. If topics emerge during data collection that require the development of a new code frame or an update to an existing code frame this will be conducted, allowing for new topics to be identified.
Patient comments are also available through the Patient Administration Portal for access by a nominated campus representative. When you log into the Patient Administration Portal, a ‘Comments’ tab is available, through this tab you can view, download and flag comments. Comments will be available at a campus level. To download the comments, simply click the ‘export’ button and you will receive the comments in an excel spreadsheet.
Q: Why are some comments in languages other than English?
A: The VHES surveys are provided in 22 languages other than English. The majority of comments collected in languages other than English are translated prior to publishing in the portal. However, some surveys completed later in the fieldwork period are returned after the cut-off date for translations. These are presented in the portal in their un-translated form. Health services may find it beneficial to use their translation services to understand these comments.
Q: Can I download patient comments? A: Verbatim comments are available for download at campus level. They are available by selecting ‘Comments in Excel’ under ‘Downloads’ to the left hand side of the detailed results page. They are also available for download at the bottom of the expanded results page by selecting ‘Download comment response’.
Q: What does the alert symbol mean?
A: An alert symbol is shown where the sample size for a particular question is less than 30. This means that the margin of error for this question is quite large (more than +/- 18%), so results should be interpreted with caution.
Q: Where can I see comparisons to the previous quarter?
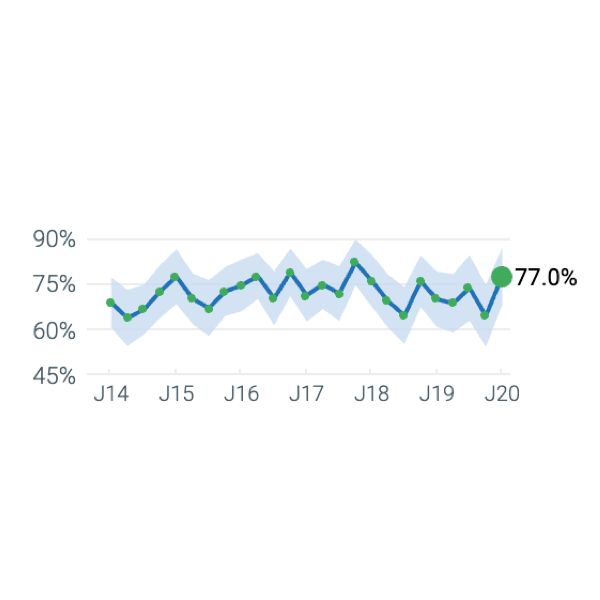
A:When looking at the detailed results for a question, the positive over time visualisation (the middle visual) will show a blue line with a data label displaying most recent reporting periods positive score. This blue line maps how the positive score has changed over time. Hovering over a point on the blue line, you will see the positive score of that time period, as well as the confidence interval and number of participants who answered that question at the level you are looking at. Significance testing is provided for the current quarter versus the previous quarter and the current quarter versus the same quarter in the previous year. If there is a green dot next to the positive score in the first visualisation, this indicates that the most recent quarter’s positive score is significantly higher than in the previous quarter. If there is a red dot, it means the positive score is significantly lower this quarter. The Comparison with previous period chart in the summary results page identifies the questions that have improved significantly in green and those that have declined significantly in red.
Q: Where can I see historic results?
A: The ‘Archived Results’ section displays survey results for patients discharged prior to Q1 2021-2022. To find these, first select the service level and patient category you would like to view and navigate to Detailed Results. If there are historic results available for the category and level, these will be displayed under the Archived Results chapter heading. Please note, only positive response questions will display, and expanded results are not available for any of the questions. Historic results are not available for interrogation using the data exploration tool, nor can they be bookmarked or saved to My Reports. Options for any Archived Results available at a level will also appear if you search for the level in the search bar at the top of any page on the website.
Q: What are Interim Results?
A: Interim Results reporting refers to the results that are updated on a daily basis that allow a user to monitor the impact of and quality improvement initiatives in a timelier fashion, while data collection for the quarter is still underway. As survey responses are collected and the data is processed, the data will be automatically uploaded to the portal. Interim results are viewable only in the portal, so downloads (PDFs, infographics, data downloads) or reporting functionality (build your own infographic, data exploration tool) is not enabled for the interim view. These functions will be available once the data has been published, after data collection is complete. While data collection is ongoing, results displaying on the Interim pages are not weighted. Results may change when published into the ‘Published results’ page as a result of weighting.
Q: How do I view ward-level results?
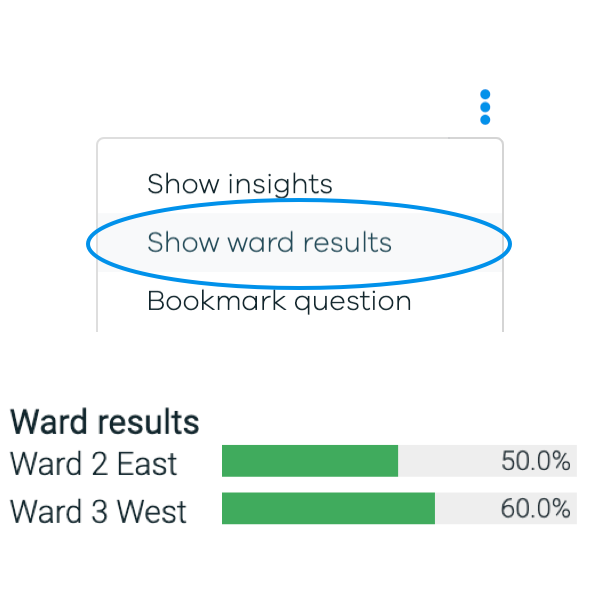
A: To view ward-level results you must be looking at the Detailed results page for your campus. Click the three blue dots in the top right corner of your question of interest. Then select ‘Show ward results’ and the ward results will appear below. Ward results are available only at campus level and for VHES portal users that have been provided permission to view ward level results for that particular campus.
Q: Am I able to view webinars and insight reports?
A: Yes. Webinars and insight reports are available in the Resources tab.
Q: What is My VHES?
A: My VHES is a personalised home page that provides a glanceable overview of key results to all portal users. Included on the My VHES page are three sections:
Q: How do I bookmark a question?
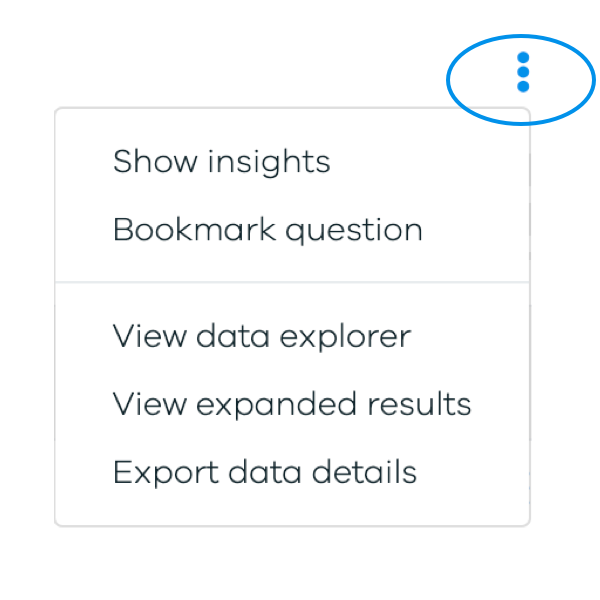
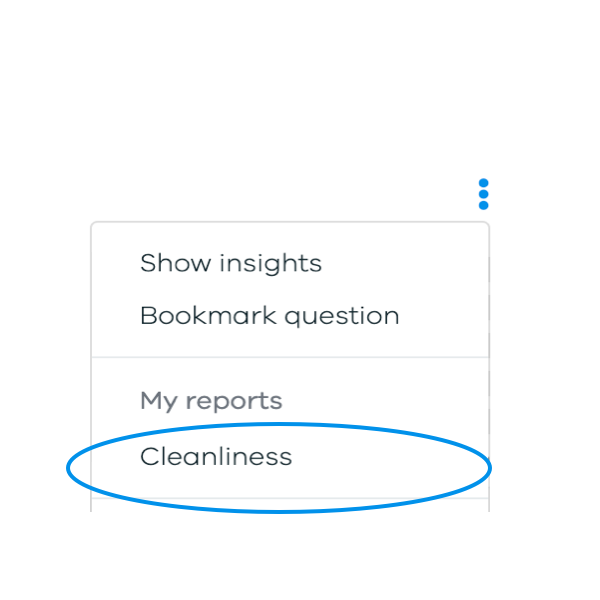
A: You can bookmark a question by clicking the three dots at the top right of a question on the detailed results page and selecting ‘Bookmark question’. This question will then be pinned to the summary results page when viewing results for that patient category.
Q: How will I know when new results are launched?
A: You will be alerted about the launch of new results through a VHES Voice. The VHES Voice newsletter will be sent directly to the email address you use to log in to the portal.
Q: What is a peer group?
A: Peer groups are clusters of hospitals that have been consolidated based on shared characteristics. More information on peer groupings is available under Peer Groups section on the Resources page.
Q: How can I access more information on the results for a specific question?
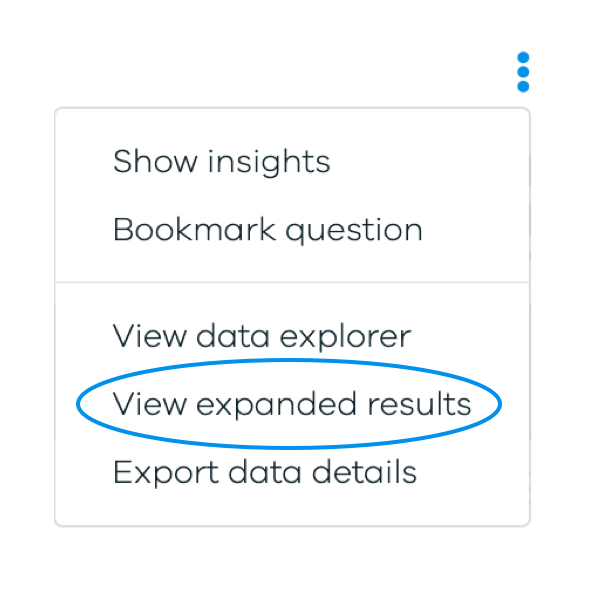
A: To view more detailed results for a question, navigate to the detailed results page and select the three blue dots in the top right of the question you wish to view. Next select ‘View expanded results’. This will open a new page with a detailed breakdown of responses to the question. You can also bookmark questions of interest; this allows you to easily view a summary of results and navigate to questions of importance.
Q: How can I compare campuses performance against others?
A: You are able to view how your campus performed relative to the Victorian, Region, Peer Group and Health Service averages via the summary results page. To compare results directly with other campuses view the expanded results for the question you would like to compare via the detailed results page.
Q: If someone returns a survey after the data collection period is over, will their responses be added to the portal?
A: No. There will be no back publishing of results. This ensures that published results (not interim results) will not change following a quarterly result launch.
Q: How can I provide feedback on the reporting portal?
A: We would like the VHES reporting portal to constantly evolve to better meet the needs of users. If you would like to provide any comments on the way results are presented, please email them to results@vhes.com.au
Answers to frequently asked questions are presented below. If these do not respond to your query, please contact us at results@vhes.com.au. A comprehensive portal user-guide is also available here for download.
Q: How many survey returns are required to obtain a report?
A: 10 surveys are required to obtain a quarterly report at any level for a reporting period (i.e. a quarter for continuous surveys, a year for annual surveys).
Q: If fewer than 10 surveys are obtained for a campus, what happens to this data? A: The data will still be reported at health service, state and peer group level, provided at least 10 survey returns are received. For continuous, core surveys (Adult Inpatient, Adult Emergency, Maternity, Paediatric Inpatient, Paediatric Emergency), if fewer than 10 surveys are returned for a quarter, these are quarantined until a future quarter. Once 10 survey returns have been received over multiple quarters, a cumulative report is produced, combining each of the quarters into a single report. The user guide has more information on cumulative reporting, with visual examples.
Q: How many responses are needed for a question to be reported?
A: Provided a campus or health service receives the minimum survey return requirement (outlined above), all individual questions will be presented, regardless of how many people answered that question. Some questions are asked only of a small subsection.
Q: What is a level?
A: A level is the unit at which a report is produced. Reports are provided at campus, health service, region, peer group and state
Q: What is the annual participation rate?
A: The annual participation rate is the rolling response rate across the previous four quarters of data collection. This is derived from the number of patients invited to participate divided by the number who completed the survey over the preceding four quarters. The annual participation rate is available for all out-of-service survey categories at all levels of reporting.
Q: What is the positive score?
A: The positive score is the proportion of patients nominating the most desired answer or answers for a question e.g. “Yes, always”. This is the score that is plotted over time and compared to other time periods, health services, peer groups, regions and state average answers classed as ‘positive’ are in green in on the dial charts throughout the portal.
Not applicable responses such as “I’m not sure”, “No, but I did not want this” or “This was not needed” are excluded from the base (denominator) when the positive score is calculated. These neutral responses are in blue and have an asterisk next to the response on the detailed results page. Responses excluded from the positive score are also detailed in the question footer on the detailed results page.
If there are two or more positive answers (such as "very good" and "good") these are added together to form the positive score. Note that due to decimal places and/or rounding they may not sum as expected.
Q: How can I see a summary of results?
A: You can see a summary of results by clicking on a patient category (e.g. Adult Inpatient) when you are on the ‘Survey Results’ page. A ‘Summary results’ tab will appear under the “Survey Results” tab which will show you a summary of results.
On the ‘Summary Results’ page you will see the participation rates, a summary overview and a chart showing overall experience all for the most recent quarter. The summary results page also provides comparisons for the questions where the subject’s performance has significantly increased or decreased compared to the previous quarter.
When viewing a summary of results for a campus, you will also see comparisons with the associated health service, peer group, region and the statewide results. These comparisons depict the aspects of care that the health service or campus performed significantly higher or lower in than the subject (i.e. state, health service and campus) they are being compared too in the most recent quarter. This feature is only available for published results and not for results published in the interim view.
Q. What are key aspects of care?
The key aspects of care are the three questions that have the greatest impact on a respondents overall experience rating. Where a respondent records positive score on these key aspects of care, they are more likely to report a positive overall experience. A key driver analysis using a binary logistic regression was conducted to determine the key aspects of care.
Q: What does it mean if a comparison is identified as significant?
A ‘significant difference’ means that we can be 95% confident that the difference observed between the two samples reflects a true difference in the population of interest and is not a result of chance. Significance testing is not conducted on interim results.
Q: How can I easily identify key questions that have increased/decreased compared to the previous quarter?
A: This information is available in the Summary Results page. The Comparison with previous period chart will highlight the questions that have improved significantly in green and highlight the questions that have experienced a significant decline in red. Hyperlinks to view detailed results for each of these questions are listed below the chart.
Q: How can I easily identify key questions where my campus or health service differs significantly from the state average?
A: This information is available in the Summary Results page. The Comparison with Victoria chart will highlight the questions that have improved significantly better than state average in green and highlight the questions that have performed significantly worse in red. Hyperlinks to view detailed results for each of these questions are listed below the chart.
Q: How can I conduct further data exploration, such as cross tabulation, within the portal?
A: The data exploration tool can be accessed through the portal by clicking on Data explorer tab on the navigation pane.
The data exploration tool facilitates user-led interrogation and analysis using a simple cross-tabulation feature for specific questions. Particular questions can be cross-tabulated against other questions to investigate relationships between the data. Results can also be filtered by patient types or patients that reported the same experiences at the state, region, peer group, health service or campus level across quarters. All analysed data appears as column percentages with significant differences represented by coloured cells. Analysed results can be viewed as tables or charts, at a point in time or over time and data is able to be downloaded to Excel.
Q: How do I interpret each question chart?
A: Please click on the ‘How to use’ heading on the left hand side menu of the page which provides detailed information on how to interpret and navigate charts and data.
Q: How frequently are results provided?
A: Published results for the Inpatient, Emergency and Maternity surveys are reported on a quarterly basis following the completion of data collection for each quarter. The quarters are as follows:
- Patients discharged in July to September (Q1)
- Patients discharged in October to December patients (Q2)
- Patients discharged in January to March (Q3)
- Patients discharged in April to June (Q4) Interim results for the Inpatient, Emergency and Maternity surveys will be updated daily.
- Community Health, Specialist Clinics, Palliative Care, Ambulance, Mental Health Carer, Your Experience of Service (Mental Health) and HACC-PYP surveys will be reported once annually based on a single three-month data collection period. See the method page for more information.
- The Cancer Experience survey will be reported every 1-3 years and is based on those with an experience of cancer care in the 12 months prior.
A: Results for each campus for inpatient, emergency and specialist clinics categories are provided only if the campus achieves the minimum survey return requirement (see above) to ensure the data is statistically robust. However, these campuses will still contribute to the peer group, region, health service and state average. Where a campus does not achieve the minimum number of survey returns, the portal will state that there is insufficient data for this period.
Q: How can I see the survey questionnaires?
A:There are distinct questionnaires for each patient category. Each include a common set of Core Questions used across all surveys, and a unique module. To download a pdf version of a questionnaire, go into the ‘Resources’ tab and beneath the heading ‘Questionnaire downloads’, choose the questionnaire you wish to download by clicking on the title.
Q: How can I see the patient comments?
A: De-identified patient comments are available at campus level for all open-ended questions on the ‘expanded results page’. Users can only see comments for campuses belonging to their health service. Patient comments are also available for download on the 'expanded results page'.
Classified patient comments are included in categorical charts on the VHES reporting portal. Comments are allocated into one or more topics or categories based upon the content of the comment. If topics emerge during data collection that require the development of a new code frame or an update to an existing code frame this will be conducted, allowing for new topics to be identified.
Patient comments are also available through the Patient Administration Portal for access by a nominated campus representative. When you log into the Patient Administration Portal, a ‘Comments’ tab is available, through this tab you can view, download and flag comments. Comments will be available at a campus level. To download the comments, simply click the ‘export’ button and you will receive the comments in an excel spreadsheet.
Q: Why are some comments in languages other than English?
A: The VHES surveys are provided in 22 languages other than English. The majority of comments collected in languages other than English are translated prior to publishing in the portal. However, some surveys completed later in the fieldwork period are returned after the cut-off date for translations. These are presented in the portal in their un-translated form. Health services may find it beneficial to use their translation services to understand these comments.
Q: Can I download patient comments? A: Verbatim comments are available for download at campus level. They are available by selecting ‘Comments in Excel’ under ‘Downloads’ to the left hand side of the detailed results page. They are also available for download at the bottom of the expanded results page by selecting ‘Download comment response’.
Q: What does the alert symbol mean?
A: An alert symbol is shown where the sample size for a particular question is less than 30. This means that the margin of error for this question is quite large (more than +/- 18%), so results should be interpreted with caution.
Q: Where can I see comparisons to the previous quarter?
A:When looking at the detailed results for a question, the positive over time visualisation (the middle visual) will show a blue line with a data label displaying most recent reporting periods positive score. This blue line maps how the positive score has changed over time. Hovering over a point on the blue line, you will see the positive score of that time period, as well as the confidence interval and number of participants who answered that question at the level you are looking at. Significance testing is provided for the current quarter versus the previous quarter and the current quarter versus the same quarter in the previous year. If there is a green dot next to the positive score in the first visualisation, this indicates that the most recent quarter’s positive score is significantly higher than in the previous quarter. If there is a red dot, it means the positive score is significantly lower this quarter. The Comparison with previous period chart in the summary results page identifies the questions that have improved significantly in green and those that have declined significantly in red.
Q: Where can I see historic results?
A: The ‘Archived Results’ section displays survey results for patients discharged prior to Q1 2021-2022. To find these, first select the service level and patient category you would like to view and navigate to Detailed Results. If there are historic results available for the category and level, these will be displayed under the Archived Results chapter heading. Please note, only positive response questions will display, and expanded results are not available for any of the questions. Historic results are not available for interrogation using the data exploration tool, nor can they be bookmarked or saved to My Reports. Options for any Archived Results available at a level will also appear if you search for the level in the search bar at the top of any page on the website.
Q: What are Interim Results?
A: Interim Results reporting refers to the results that are updated on a daily basis that allow a user to monitor the impact of and quality improvement initiatives in a timelier fashion, while data collection for the quarter is still underway. As survey responses are collected and the data is processed, the data will be automatically uploaded to the portal. Interim results are viewable only in the portal, so downloads (PDFs, infographics, data downloads) or reporting functionality (build your own infographic, data exploration tool) is not enabled for the interim view. These functions will be available once the data has been published, after data collection is complete. While data collection is ongoing, results displaying on the Interim pages are not weighted. Results may change when published into the ‘Published results’ page as a result of weighting.
Q: How do I view ward-level results?
A: To view ward-level results you must be looking at the Detailed results page for your campus. Click the three blue dots in the top right corner of your question of interest. Then select ‘Show ward results’ and the ward results will appear below. Ward results are available only at campus level and for VHES portal users that have been provided permission to view ward level results for that particular campus.
Q: Am I able to view webinars and insight reports?
A: Yes. Webinars and insight reports are available in the Resources tab.
Q: What is My VHES?
A: My VHES is a personalised home page that provides a glanceable overview of key results to all portal users. Included on the My VHES page are three sections:
- My saved patient categories: a shortcut to view results of a patient category at a service level. Users can save a page to this section by clicking on the star next to the title of the page they’d like to save. Pages are saved at the patient category and service level, for example, Adult Inpatient at Hospital XY.
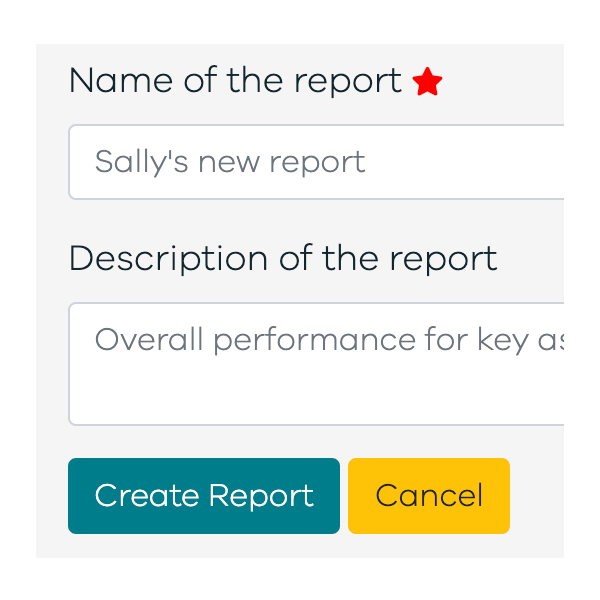
- My reports: Shortcuts to view custom reports created. This function allows users to create a custom report by adding different questions across different service levels to a report. All the questions added will display within the nominated report.
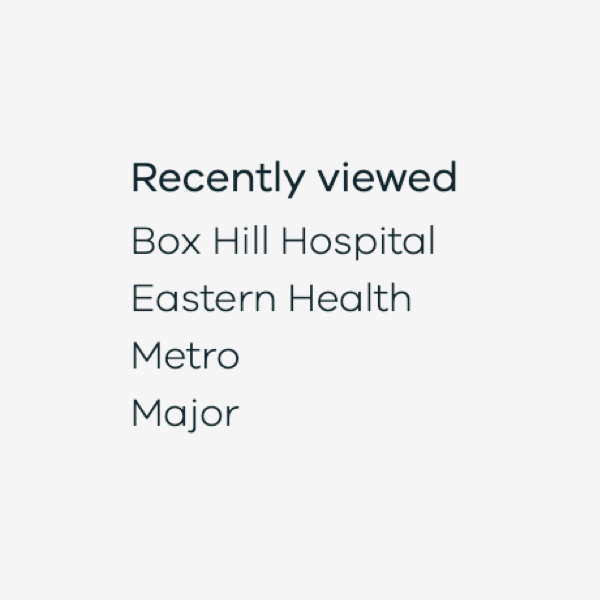
- My recently viewed: Shortcuts to your five most recently viewed service levels.
Q: How do I bookmark a question?
A: You can bookmark a question by clicking the three dots at the top right of a question on the detailed results page and selecting ‘Bookmark question’. This question will then be pinned to the summary results page when viewing results for that patient category.
Q: How will I know when new results are launched?
A: You will be alerted about the launch of new results through a VHES Voice. The VHES Voice newsletter will be sent directly to the email address you use to log in to the portal.
Q: What is a peer group?
A: Peer groups are clusters of hospitals that have been consolidated based on shared characteristics. More information on peer groupings is available under Peer Groups section on the Resources page.
Q: How can I access more information on the results for a specific question?
A: To view more detailed results for a question, navigate to the detailed results page and select the three blue dots in the top right of the question you wish to view. Next select ‘View expanded results’. This will open a new page with a detailed breakdown of responses to the question. You can also bookmark questions of interest; this allows you to easily view a summary of results and navigate to questions of importance.
Q: How can I compare campuses performance against others?
A: You are able to view how your campus performed relative to the Victorian, Region, Peer Group and Health Service averages via the summary results page. To compare results directly with other campuses view the expanded results for the question you would like to compare via the detailed results page.
Q: If someone returns a survey after the data collection period is over, will their responses be added to the portal?
A: No. There will be no back publishing of results. This ensures that published results (not interim results) will not change following a quarterly result launch.
Q: How can I provide feedback on the reporting portal?
A: We would like the VHES reporting portal to constantly evolve to better meet the needs of users. If you would like to provide any comments on the way results are presented, please email them to results@vhes.com.au
